Acquisition project | Finominal
Understanding the product
Finominal is an investment analytics platform that helps investors analyze and gain better clarity on their investment portfolios. Think of it as Google Analytics for investors. Our mission is to become the go-to place for investors to get an independent and unbiased perspective on their portfolios. We have over 2,500 users who use our tools to analyze various portfolios and securities, including mutual funds, ETFs, and stocks.


Understand the user
Macro Objective: Customer Retention and Satisfaction Strategy
Understanding the factors that influence users to continually use Finominal and what features drive the most satisfaction.
Micro Objective 1: Understanding User Engagement and Feature Usage
- How often do you use Finominal?
- Which tools or features do you use the most? Why?
Micro Objective 2: Understanding user routine and concerns
- Can you walk me through your process of analyzing an investment using Finominal?
- What specific data or analytics do you look for when evaluating an investment?
- How do Finominal's tools compare to other platforms you have used for investment analysis?
- What kind of information is missing or hard to find on Finominal that would help you in your investment decisions?
- Have you ever decided not to use Finominal for a particular analysis? Why?
User | Occupation | Objective | Insights drawn |
|---|---|---|---|
Julia | Hedge Fund Advisor | Find out which aspect of the tool impressed her | Doubling down on products like Alpha Analyzer and Diversification Booster |
Wiggins | Financial Advisor | Find out how he uses our platform to make investment decisions | Quality of analysis is top notch and the ease of use |
One thing to note about our users is that they are dealing with two of the most challenging aspects of life: money and people. Access to valuable insights and high-quality data is their top priority.
Our product seems to be an absolute necessity, especially as more funds are created each year. The demand for new analytics and unbiased perspectives is growing rapidly. Finominal meets this need by providing investors with the tools and insights required to make informed decisions in an increasingly complex market.
Ideal Customer Profile
Let's first understand some of the categories of investment professionals who are in need or already using portfolio analytics software.

Let's apply the Ideal Customer Profile (ICP) framework to the above potential customer categories to focus on one or two specific sets.
Category | Adoption Curve | Frequency of Use | Appetite to Pay | TAM | Distribution Potential |
|---|---|---|---|---|---|
Financial Advisors | Early Majority | Daily | High | Large | High |
Portfolio Managers | Early Adopters | Daily | Very High | Moderate | Moderate |
Asset Managers | Early Majority | Daily | High | Moderate | Moderate |
Pension Fund Managers | Early Majority | Weekly to Daily | Very High | Large | Moderate |
Research Analysts | Early Majority | Daily | Moderate | Moderate | Moderate |
Retail Investors | Early to Late Majority | Weekly to Daily | Low | Very Large in general | High |
From the table above, we can identify Financial Advisors and Portfolio/Asset Managers as our main ideal customers due to their high frequency of use, strong willingness to pay, sizeable TAM, and readiness to adopt new technology.
Financial Advisors
- Why:
- High frequency of use ensures daily engagement.
- Large TAM with over 300,000 advisors in the U.S. alone.
- High appetite to pay as they charge clients for their services.
- High distribution potential through various channels like industry conferences, professional networks, and webinars.
- How:
- Webinars and Workshops: Educate financial advisors on how your tools can solve specific challenges.
- Tailored Content: Produce targeted content addressing their pain points and showcasing benefits.
- Client Testimonials and Case Studies: Use success stories from other financial advisors.
- Partnerships: Partner with financial advisory firms and industry associations.
- Influencers:
- Industry analysts providing favorable reviews.
- Peers within financial planning networks recommending the product.
- Blockers:
- Budget limitations in smaller advisory firms.
- Regulatory compliance and ensuring the platform meets all industry standards.
- Concerns about integration with existing CRM and financial planning tools.
Portfolio Managers & Asset Managers
- Why:
- Early adopters of advanced analytical tools.
- Very high frequency of use and willingness to pay.
- Moderate TAM with thousands of portfolio managers globally.
- Moderate distribution potential through specialized media and direct sales.
- How:
- Advanced Analytics Features: Highlight sophisticated tools for performance tracking and risk management.
- Direct Outreach: Use direct sales efforts and attend institutional investment conferences.
- Influencers:
- Senior management within investment firms pushing for competitive advantage.
- Key opinion leaders in financial media endorsing the platform.
- Blockers:
- Integration challenges with existing portfolio management systems.
- Regulatory compliance and ensuring the platform meets all industry standards.
Given that we charge $150, targeting retail customers is out of the picture. Although retail focus can bring in a lot of traction to the website, the appetite to pay is very low for the price point and also the kind of analytics we provide is difficult to comprehend without some basic finance knowledge.
Attribute | Financial Advisors and Planners | Portfolio Managers |
|---|---|---|
| Demographics | ||
Age | 30-55 years old | 35-50 years old |
Gender | Predominantly male, but increasing female representation | Predominantly male |
Location | US, Canada, Australia, India, UK, Switzerland, Europe | US, Canada, Australia, India, UK, Switzerland, Europe |
| Professional Characteristics | | |
Company Size | Small to medium (5-50 employees) | Medium to large (50-500 employees) |
Industry Domain | Financial services, wealth management | Investment management, asset management, hedge funds |
Roles | Financial advisors, planners, wealth managers | Portfolio managers, investment managers, fund managers |
Experience Level | Mid to senior-level (5-20 years) | Senior-level (10-25 years) |
Org Structure | Flat to moderately hierarchical | Highly hierarchical |
| Behavioral Characteristics | ||
GMV/Funding Raised | Not typically applicable, focus on AUM | High AUM, managing millions to billions of dollars |
#sales, #dev, #marketers | Emphasis on sales and client relationship management | Emphasis on investment roles, client acquisition |
Growing/Saturated? | Growing industry | Competitive but growing industry |
Social Media Use | LinkedIn, Twitter for professional use | LinkedIn, Twitter for market updates |
| Personal Characteristics | ||
What do they watch/read/listen? | Financial news (Bloomberg, CNBC), industry publications (Financial Times, WSJ), investment podcasts | Financial news (Bloomberg, CNBC), industry reports, investment research publications (Morningstar, Institutional Investor), financial podcasts |
Who do they follow? | Industry leaders, financial influencers, regulatory bodies | Renowned investors, market analysts, industry thought leaders |
| Technology Use | ||
Preferred Devices | Desktop and mobile for financial planning tools | Desktop and specialized software for portfolio management |
Software Use | CRM systems, financial planning software | Advanced analytics tools, risk management software |
| Pain Points | ||
Main Challenges | Client acquisition and retention, regulatory compliance, integrating new tools with existing systems | Achieving consistent performance, managing risk, integrating advanced analytics with existing systems |
| Needs and Goals | ||
Primary Needs | Efficient client management tools, reliable financial planning software, compliance support | Advanced performance tracking, risk management tools, comprehensive analytics |
Long-term Goals | Grow client base, increase AUM, enhance client satisfaction | Achieve high returns, manage large portfolios effectively, maintain competitive edge |
| Buying Process | ||
Decision Makers | Senior partners, firm owners | Senior management, investment committee |
Influencers | Industry analysts, peers, key opinion leaders | Senior management, renowned investors, market analysts |
Blockers | Budget constraints, integration challenges, change resistance | Regulatory compliance, integration challenges, high cost |
| Preferred Content | ||
Informational Sources | Industry publications, webinars, professional networks | Industry reports, financial news, research publications |
Content Formats | Articles, whitepapers, case studies, webinars | Research reports, in-depth analysis, webinars |
Product Category and Competitor Analysis
Market Penetration
With the investment analytics market having about 50% penetration by competitors, Finominal faces both opportunities and challenges as a startup. With the market only half-penetrated, there is significant room for growth. Finominal can target the remaining 50% of the market that is not yet fully served or is seeking better solutions.

Source: T3 report
Competitors
One takeaway from the T3 report report is that many advisory firms use more than one of the following software tools, which indicates that they might also try out and adopt our tools.
Each software tool serves a specific purpose, and no single tool excels at everything. For example, Nitrogen is used by advisors for risk scoring, managing clients, and portfolio analysis. YCharts provides access to all market data. Kwanti tools are especially focused on analyzing model portfolios.

Source: T3 report
Shortlisted Competitors List
Name | Company Link | Geographical Focus |
Morningstar | Global | |
Kwanti | USA | |
Portfolio Visualizer | USA | |
YCharts | USA | |
Venn | USA |
Strong points of Finominal compared to the competitors:
- Ability to analyze a fund or portfolio using 15 different analytical tools. All the above tools have a few screens of analytics which by no means are bad but not comprehensive enough to analyze a fund or portfolio.
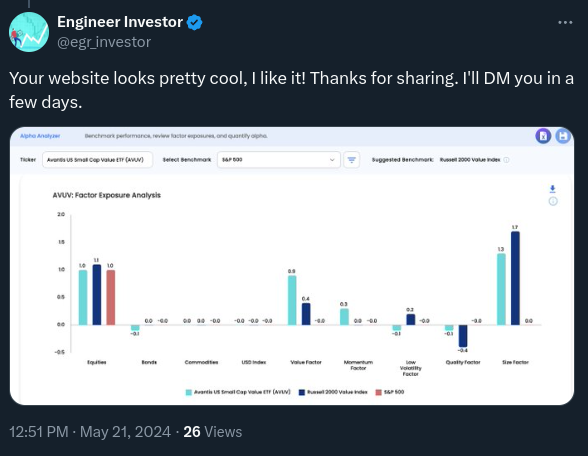
- We provide the most unique, innovative, and research-backed tools. Tools like Fee Reducer, Alpha Analyzer, and Portfolio Consultant really stand out and help investors unravel the truth in seconds.
- All our tools are open to use for everyone even without signing up or booking a demo. Only for saving more than 3 portfolios, the user needs to sign up and subscribe to the premium plan.
- We cover 10+ markets which makes us truly global. Most of our competitors are only USA-focused.
Weak points of Finominal compared to the competitors:
- We are not regulated.
- Reports are not customizable.
- Quality of data in some cases.
Product Space and Core USP
Financial advisors and portfolio managers across these 7 markets sum up to about 1 million users. Coincidently the number came close to the CFA Institute's estimation. According to the CFA Institute, the total number of core investment professionals was estimated to be approximately 1.05 million at the end of 2018.


Source used to estimate the TAM:
Canada: Link1
Australia: Link1
UK: Link1
Europe: Link1
Switzerland: Link1
The Serviceable Addressable Market (SAM) is the portion of the TAM that can be effectively targeted based on market penetration and the specific focus of the product. The good thing is we have a market penetration number for the specific focus of our product from the Product Category and Competitor Analysis section. 50.6% is the market penetration.
SAM = TAM × Market Penetration
SAM = $1.8 billion × 50.6% = $936 million
Serviceable Obtainable Market:
- Optimistic: Capture 10% of SAM (assuming the product is highly competitive and can gain significant market share)
- SOM = 10% × SAM = 10% × $936 million = $94 million
- Base Case: Capture 5% of SAM
- SOM = 5% × SAM = 5% × $936 million = $47 million
- Pessimistic: Capture 2% of SAM
- SOM = 2% × SAM = 2% × $936 million = $19 million
So.
It seems like 1 million users is the ceiling. But do we meet the needs of all 1 million users? Not exactly. There's a reason why there is no single monopoly in this space. Okay, you got me—Morningstar has a huge market share. For example, in the US, 170,000 advisors out of 300,000 use Morningstar's platform. That's a significant market share of 56%. Is that bad news? No.
If you read the competitors' section again, you'll notice that advisors often use more than one tool. This means that even users who are using Morningstar prefer to have another tool for analytics, CRM, and more. More importantly, the sheer breadth of investment research solutions is a reminder that advisors have a wide range of investment styles and tend to pick particular investment analytics tools that fit the needed analyses for their specific approach. Let me explain what I mean by using each competitor's core value proposition and comparing it with our core value proposition. Obviously, each company has many things to offer, but we're focusing on their core value proposition.
Core value proposition:
- Morningstar - Fund data quality
- Kwanti - Model portfolio management
- Portfolio Visualizer - Historical backtester
- Ycharts - Extensive data coverage
- Venn - Advanced risk analysis
- Finominal - Benchmark analysis
Acquisition Channels
I'm going to choose Organic Search and Content Loops as our two main acquisition channels because there are numerous ETFs, mutual funds, and stocks across all seven markets that can be used to create content. For example, the S&P 500 ETF (SPY) is a well-known fund worldwide.
Content Loops
The content loop could be the most effective acquisition strategy for Finominal. Investors are consistently seeking in-depth analysis of funds and portfolios across various markets, and our YouTube channel could become the go-to resource for such analytical videos. During these analysis, we will utilize our platform to demonstrate how funds and portfolios can be analyzed and the insights that can be derived from them.
There will never be a shortage of content ideas because there are thousands of funds and countless portfolio combinations to analyze. For example, there are over 25,000 mutual funds in the US and 200,000 across all of Europe. This vast pool of content opportunities ensures that we can continually provide fresh and valuable content to our audience.
Experiment 1:
- Create a YouTube channel for each of the seven markets and publish review videos weekly.
- Look for highly searched fund or portfolio names and conduct analyses on them. For example, the keyword "DBMF" is searched by 1,900 people every month. For context, DBMF is one of the modern new alternative funds in the US. We can also produce videos for heavily searched keywords like "VOO," which has an average search volume of about 2 million.
- While testing this strategy a few weeks back we found it successful as there was no competition for that keyword on YouTube.


Finominal US: https://www.youtube.com/@Finominal
Finominal Inida: https://www.youtube.com/@Finominal-India
Organic Search
Organic search plays a crucial role in this space as financial advisors look for price data or specific key information about a fund. Big players like Morningstar, and Yahoo Finance have heavily indexed pretty much all funds and stocks in the world.
Type of search | Keyword | Search volume (avg monthly) | Difficulty to rank on seo | Time to get an outcome | Search result to click rate | Visitor to start trial date | Potential monthly signups |
Use case | portfolio backtester | 8.1k | Low | Medium | High | High | 100-500 |
Competitor | SPY yahoo | 4.4k | High | Slow | Medium | Medium | 300-500 |
Your product | investment strategies | 40.5k | Medium | Slow | High | High | 1000-5000 |
Experiment 2:
Index all the funds to increase visibility. Competitors will obviously rank higher, so we need to be creative and provide unique analyses to improve our rankings. For example, Portfolioslab.com, founded in 2018, has 2.2 million views per month due to this strategy. Their top keywords are simply comparisons of two funds, such as "vti vs voo." When you type that keyword, Portfolioslab.com's analysis ranks first. This keyword has a search volume of 14.8k.
By leveraging this strategy, we can attract a significant amount of traffic. Creating detailed comparisons and unique insights will help us stand out and rank higher in search results.


Interesting to see that their top referring sites includetwo of the best LLMs out there.

Brand focused courses
Great brands aren't built on clicks. They're built on trust. Craft narratives that resonate, campaigns that stand out, and brands that last.


All courses
Master every lever of growth — from acquisition to retention, data to events. Pick a course, go deep, and apply it to your business right away.


Explore courses by GrowthX
Built by Leaders From Amazon, CRED, Zepto, Hindustan Unilever, Flipkart, paytm & more
Course
Advanced Growth Strategy
Core principles to distribution, user onboarding, retention & monetisation.
58 modules
21 hours
Course
Go to Market
Learn to implement lean, balanced & all out GTM strategies while getting stakeholder buy-in.
17 modules
1 hour
Course
Brand Led Growth
Design your brand wedge & implement it across every customer touchpoint.
15 modules
2 hours
Course
Event Led Growth
Design an end to end strategy to create events that drive revenue growth.
48 modules
1 hour
Course
Growth Model Design
Learn how to break down your North Star metric into actionable input levers and prioritise them.
9 modules
1 hour
Course
Building Growth Teams
Learn how to design your team blueprint, attract, hire & retain great talent
24 modules
1 hour
Course
Data Led Growth
Learn the science of RCA & experimentation design to drive real revenue impact.
12 modules
2 hours
Course
Email marketing
Learn how to set up email as a channel and build the 0 → 1 strategy for email marketing
12 modules
1 hour
Course
Partnership Led Growth
Design product integrations & channel partnerships to drive revenue impact.
27 modules
1 hour
Course
Tech for Growth
Learn to ship better products with engineering & take informed trade-offs.
14 modules
2 hours
Crack a new job or a promotion with ELEVATE
Designed for mid-senior & leadership roles across growth, product, marketing, strategy & business


Learning Resources
Browse 500+ case studies, articles & resources the learning resources that you won't find on the internet.

Patience—you’re about to be impressed.